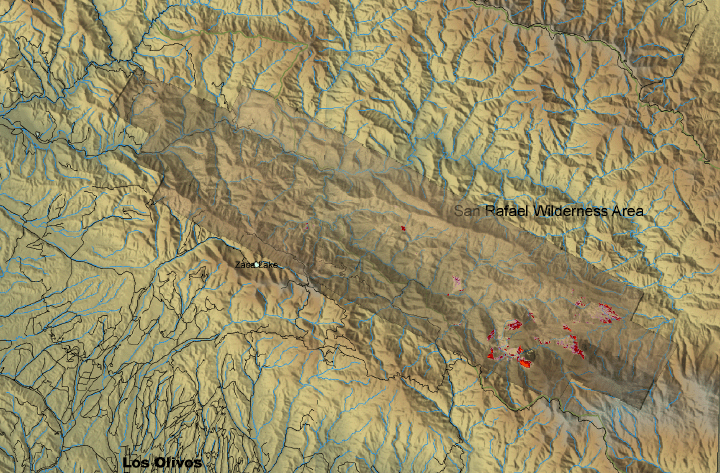
Zaca Fire, Santa Barbara County, CA
15:15 PDT 16 July 2007
As viewed by the FireMapper™ Thermal-Imaging Radiometer
|
|
Click on the image above to view a larger Zoomify image
or view the JPEG version
(opens a new browser window)
Current Image: Thermal mosaic
Ground surface temperatures as viewed from above at 11.9 micrometers wavelength on 16 July 2007, between 15:15 and 15:54 PDT.
|
| |
|
Image 1: Thermal Mosaic
Plan view of fire. Warmer tones represent recent or active combustion; areas of light gray are cooling ash or warm bare ground and the low temperatures of unburned forest and cool ground are shown in darker gray (see chart above).
Purple is used to show very warm ground that may or may not be fire-related. Purple pixels immediately adjacent to red pixels can be interpreted to be cooling ash; purple pixels far from any red pixels may be interpreted as solar heating on bare rock.
|
Click on the image above to view a larger JPEG image
(opens a new browser window) |
|
|
|
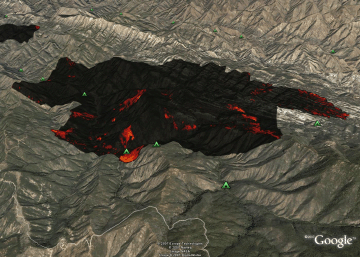
Image 2: Mosaic Overlay
Topographic view from the south.
No vertical exaggeration.

View the Zaca Fire in Google Earth.
Locations approximate.
|
Click on the image above to view a larger JPEG image
(opens a new browser window) |
|
|
|
| |
|
Weather conditions at time of data collection :
from NOAA ROMAN system. |
Past Weather Conditions for FGMC1
Observations prior to selected time: July 16, 2007 - 16:00 PDT
Weather Conditions at July 16, 2007 - 15:14 PDT
|
15:14 |
24 Hour Max |
24 Hour Min |
| Temperature |
76.0° F |
80.0 at 16:14 |
70.0 at 7:14 |
| Dew Point |
50.6° F |
53.9 at 13:14 |
40.2 at 0:14 |
| Relative Humidity |
41% |
44 at 20:14 |
25 at 0:14 |
| Wind Speed |
2 mph from SSW |
5 at 14:14 |
0 at 19:14 |
| Wind Gust |
9 mph |
13 at 0:14 |
0 at 7:14 |
| Solar Radiation |
685.0 W/m*m |
966.0 at 14:14 |
0.0 at 21:14 |
| Fuel Temperature |
88.0° F |
94.0 at 12:14 |
67.0 at 4:14 |
| 10 hr Fuel Moisture |
7 gm |
7 at 7:14 |
6 at 16:14 |
| Battery voltage |
13.00 volt |
13.10 at 18:14 |
12.60 at 4:14 |
|